
Denison University admissions office announced that the acceptance rate for the incoming class of 2017 is 45.5 percent, lower than last year’s acceptance rate of 48.3 percent.
Overall, there were 4,850 applicants. According to Dean of Admissions Perry Robinson, the pool of students applying for binding Early Decision (designating Denison as their first choice) was one of the largest in recent history. He credits this to “a strong campaign.” Of the 224 applicants for Early Decision, 174 (78 percent) were accepted, meaning that students that applied to Denison early will make up nearly 30 percent of the class of 2017.
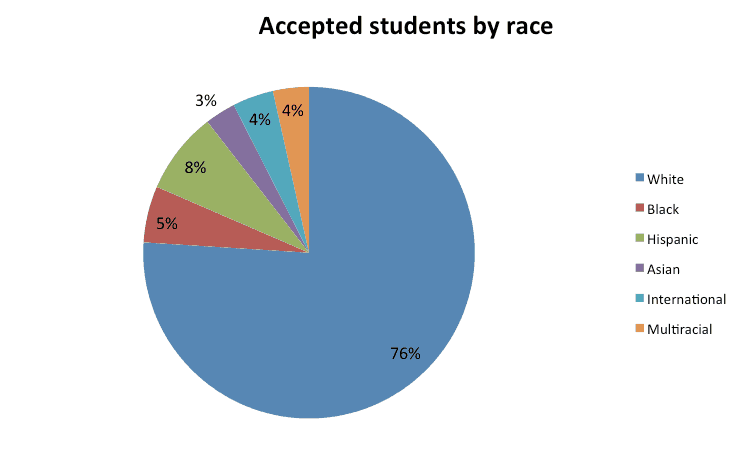
Of the 2,145 accepted students, 119 are African-American, 68 are Asian American, 171 are Hispanic American, two are Native American, 83 are international students, and 75 are multiracial. Overall, 20 percent of accepted students for the class of 2017 are students of color. In terms of gender, 60 percent of the accepted students are female.
Robinson points out that the majority of students accepted through Early Decision were male, and that Admissions is hoping this will “offset the gender imbalance.”
Two thirds of accepted students are from public schools. The average GPA was 3.6. In terms of test scores, the average ACT was 29 and the average SAT was 1295 (on a 1600 point scale). The average SAT score is up slightly from last year’s average of 1286.
While higher SAT scores and a lower acceptance rate might be signs of higher selectivity, but Dean Robinson says, “it’s the worst thing you can do to judge the quality of an institution.” Robinson points out that acceptance rates can be “easily manipulated” in different ways. One of these ways, he says, is when colleges send out one page applications and waive the fee. This allows them to inflate the number of applicants and lower their acceptance rate.
Robinson also points out that “the economy and demographics of the country affects the number of applications.” For example, in 2006, Denison received over 5,200 applications and accepted just 39 percent of them.
For Robinson, the formula is simple: “When the economy is doing well, you get more applicants than usual. When there are more high school graduates, you get more applicants.” Robinson adds that during the 2008 recession, Denison began to receive fewer applications. He says, “We’re still recovering from [that].”
Another factor in acceptance rates is the desired class size. For the class of 2017, Robinson is projecting “605 students [with] a yield rate of 27 percent.” The yield rate is the percentage of accepted students that decide to come to Denison.
According to Robinson, in the past, the college has increased the class size for “financial purposes.” 65 percent of Denison’s budget comes from students’ tuition.
According to U.S. News & World Report’s methodology for their annual college rankings, “student selectivity” is 15 percent of a school’s ranking.
With a lower acceptance rate, Denison could rise in the rankings. While Robinson knows that some students and their families may rely on rankings and acceptance rates in the decision making process, he says, “Acceptance rates don’t tell you anything about a school… [or] about its social culture, its faculty, or its resources.”